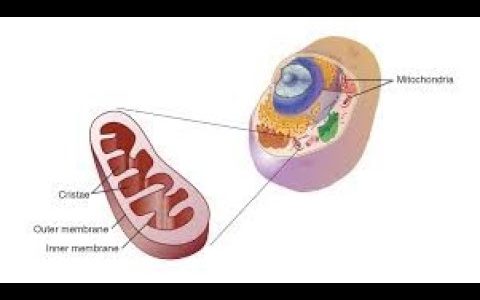
Learn how to use FIJI (ImageJ) to analyze fluorescent 2D, 3D (z-stacks) and time-lapse images of mitochondria. This tutorial demonstrates the use of the plugin called Mitochondria Analyzer, which showcases a semi-automated pipeline of image pre-processing, object detection by adaptive or local thresholding, post-processing, and extraction of morphological and network characteristics of mitochondria. The plugin also has the ability to combine morphological or networking with functional analysis through simultaneous intensiometric measurements of co-stained mitochondrial reporters, allowing for “morpho-functional” measurement of mitochondria. Automatic batch thresholding and analysis can also be done.
Chapter timeline:
0:00 Introduction
0:37 Mitochondria Analyzer pipeline for 2D images
5:04 Analysis Pipeline for 3D (z stack) images
7:10 Analysis Pipeline for time lapse images
9:26 Batch analysis
Installation instructions and detailed manual: https://github.com/AhsenChaudhry/Mitochondria-Analyzer
***URL to add to Fiji update sites: http://sites.imagej.net/ACMito/
Plugin citation:
Chaudhry A, Shi R, Luciani DS. A Pipeline for Multidimensional Confocal Analysis of Mitochondrial Morphology, Function, and Dynamics in Pancreatic β-cells. Am J Physiology-Endocrinology Metab (2020) 318:E87–E101. doi:10.1152/ajpendo.00457.2019
Image citation:
z-stack: Brenda Kostelecky (2011) CIL:11933, Rattus. CIL. Dataset. https://doi.org/doi:10.7295/W9CIL11933
timelapse image: Kasturi Mitra (2011) CIL:9070, Rattus, fibroblast. CIL. Dataset. https://doi.org/doi:10.7295/W9CIL9070
SUBSCRIBE to have first access to new video tutorials: https://www.youtube.com/@johanna.m.dela-cruz
source